
.webp)

We're excited to share one of our biggest updates yet. cosmos™ now connects seamlessly to internal and external data sources and visualizes KPI history through our new trend curves.
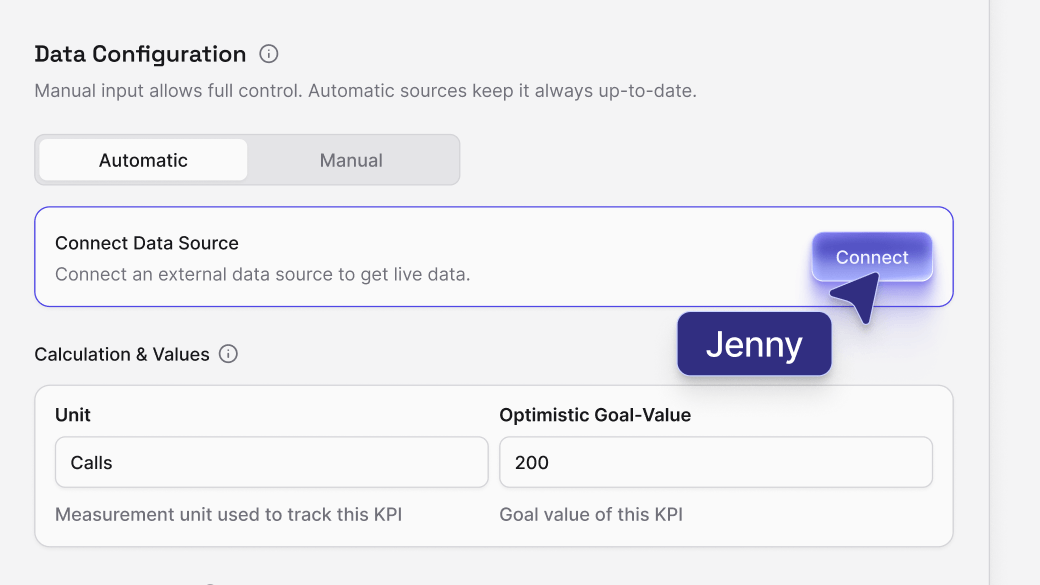
Stay data-driven without manual effort: connect any internal or external data source – from ad managers and analytics tools to CRMs – directly to your KPIs. cosmos™ enables fully automated updates of your key performance indicators in any custom rhythm: fixed time frames, recurring intervals, or dynamic rolling windows.
Define exactly which data you need, where it comes from, and how often it refreshes – cosmos™ takes care of the rest. Your KPI cosmos becomes a living, self-updating ecosystem.
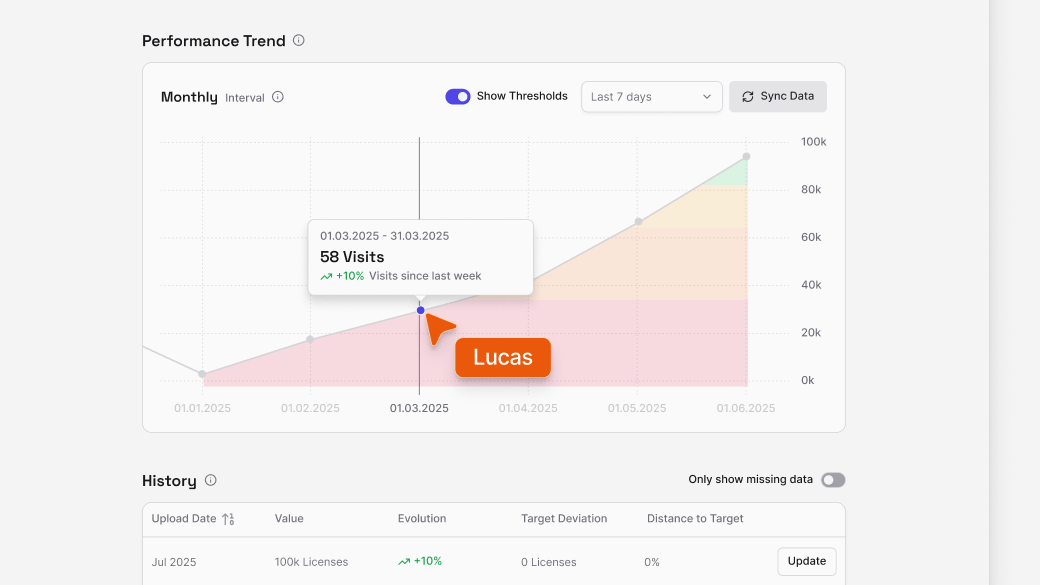
Every KPI now comes with its own historical timeline. All updates are stored automatically and displayed as a dynamic trend curve across selected time periods. See long-term developments, track the impact of strategic changes, and visualize progress directly within your impact chain. In addition, you can now define precise percentage thresholds for each status level (critical, poor, moderate, good) and see them directly next to the KPI.

From a smarter way to visualize your data to more flexible company management and a seamless light/dark experience – discover all the new features now.
Work the way you like: switch seamlessly between light and dark modes to match your environment or personal preference.
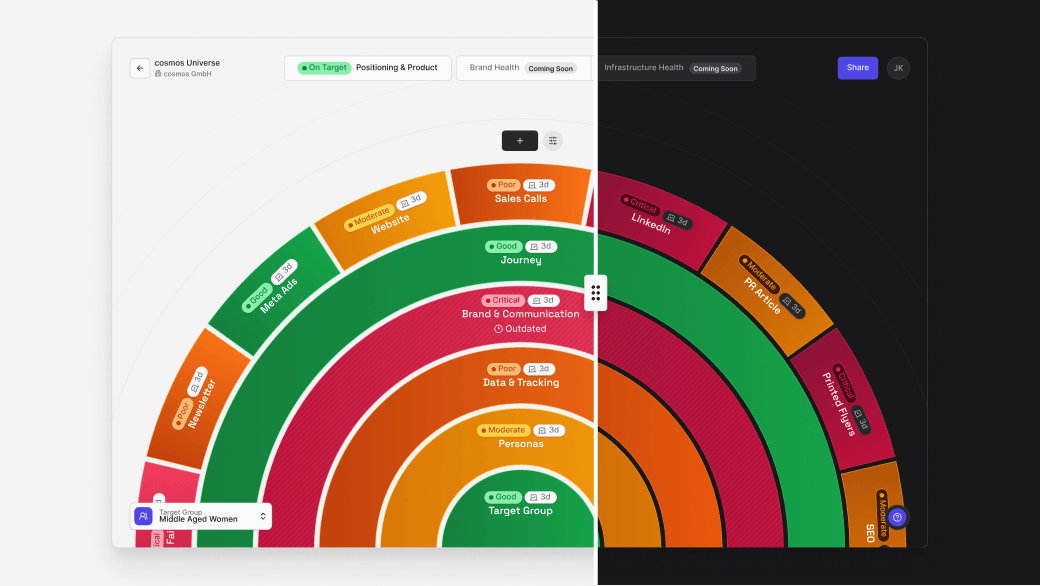
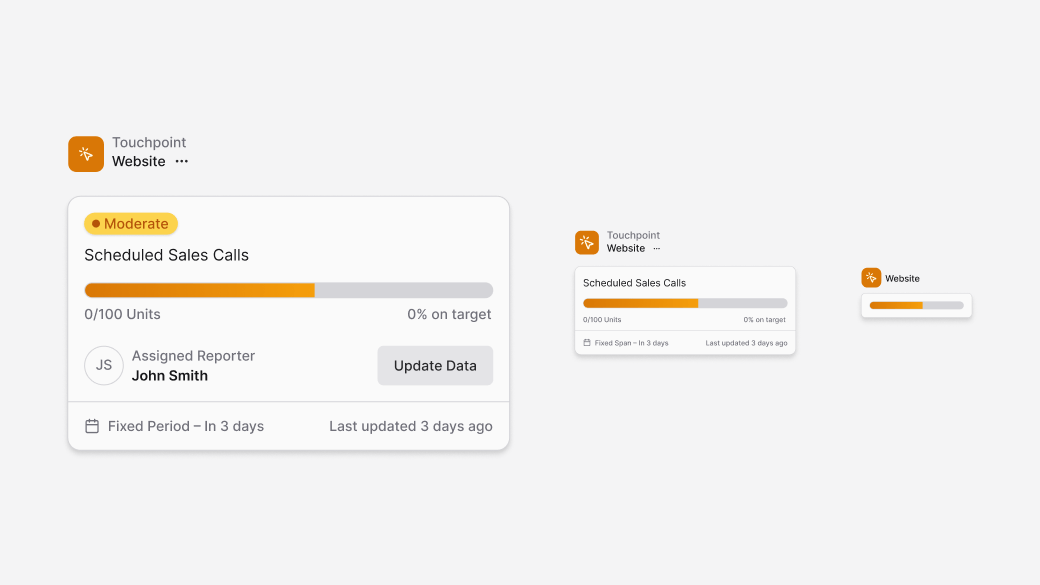
You can now zoom through your KPI map with dynamic Level of Detail states. The further you zoom out, the more simplified each element becomes – helping you stay oriented at a glance. Zoom in for full context when you need detail.

You can now manage your account in an even more flexible and structured way – from user roles to multiple independent workspaces under one company account.
