Know which initiatives drive your goals – before you burn budget
What works and where do you need to course-correct? cosmos™ brings the initiatives, metrics and context behind your go-to-market into one place.
For CMOs, CROs and Heads of Marketing, Sales & Growth
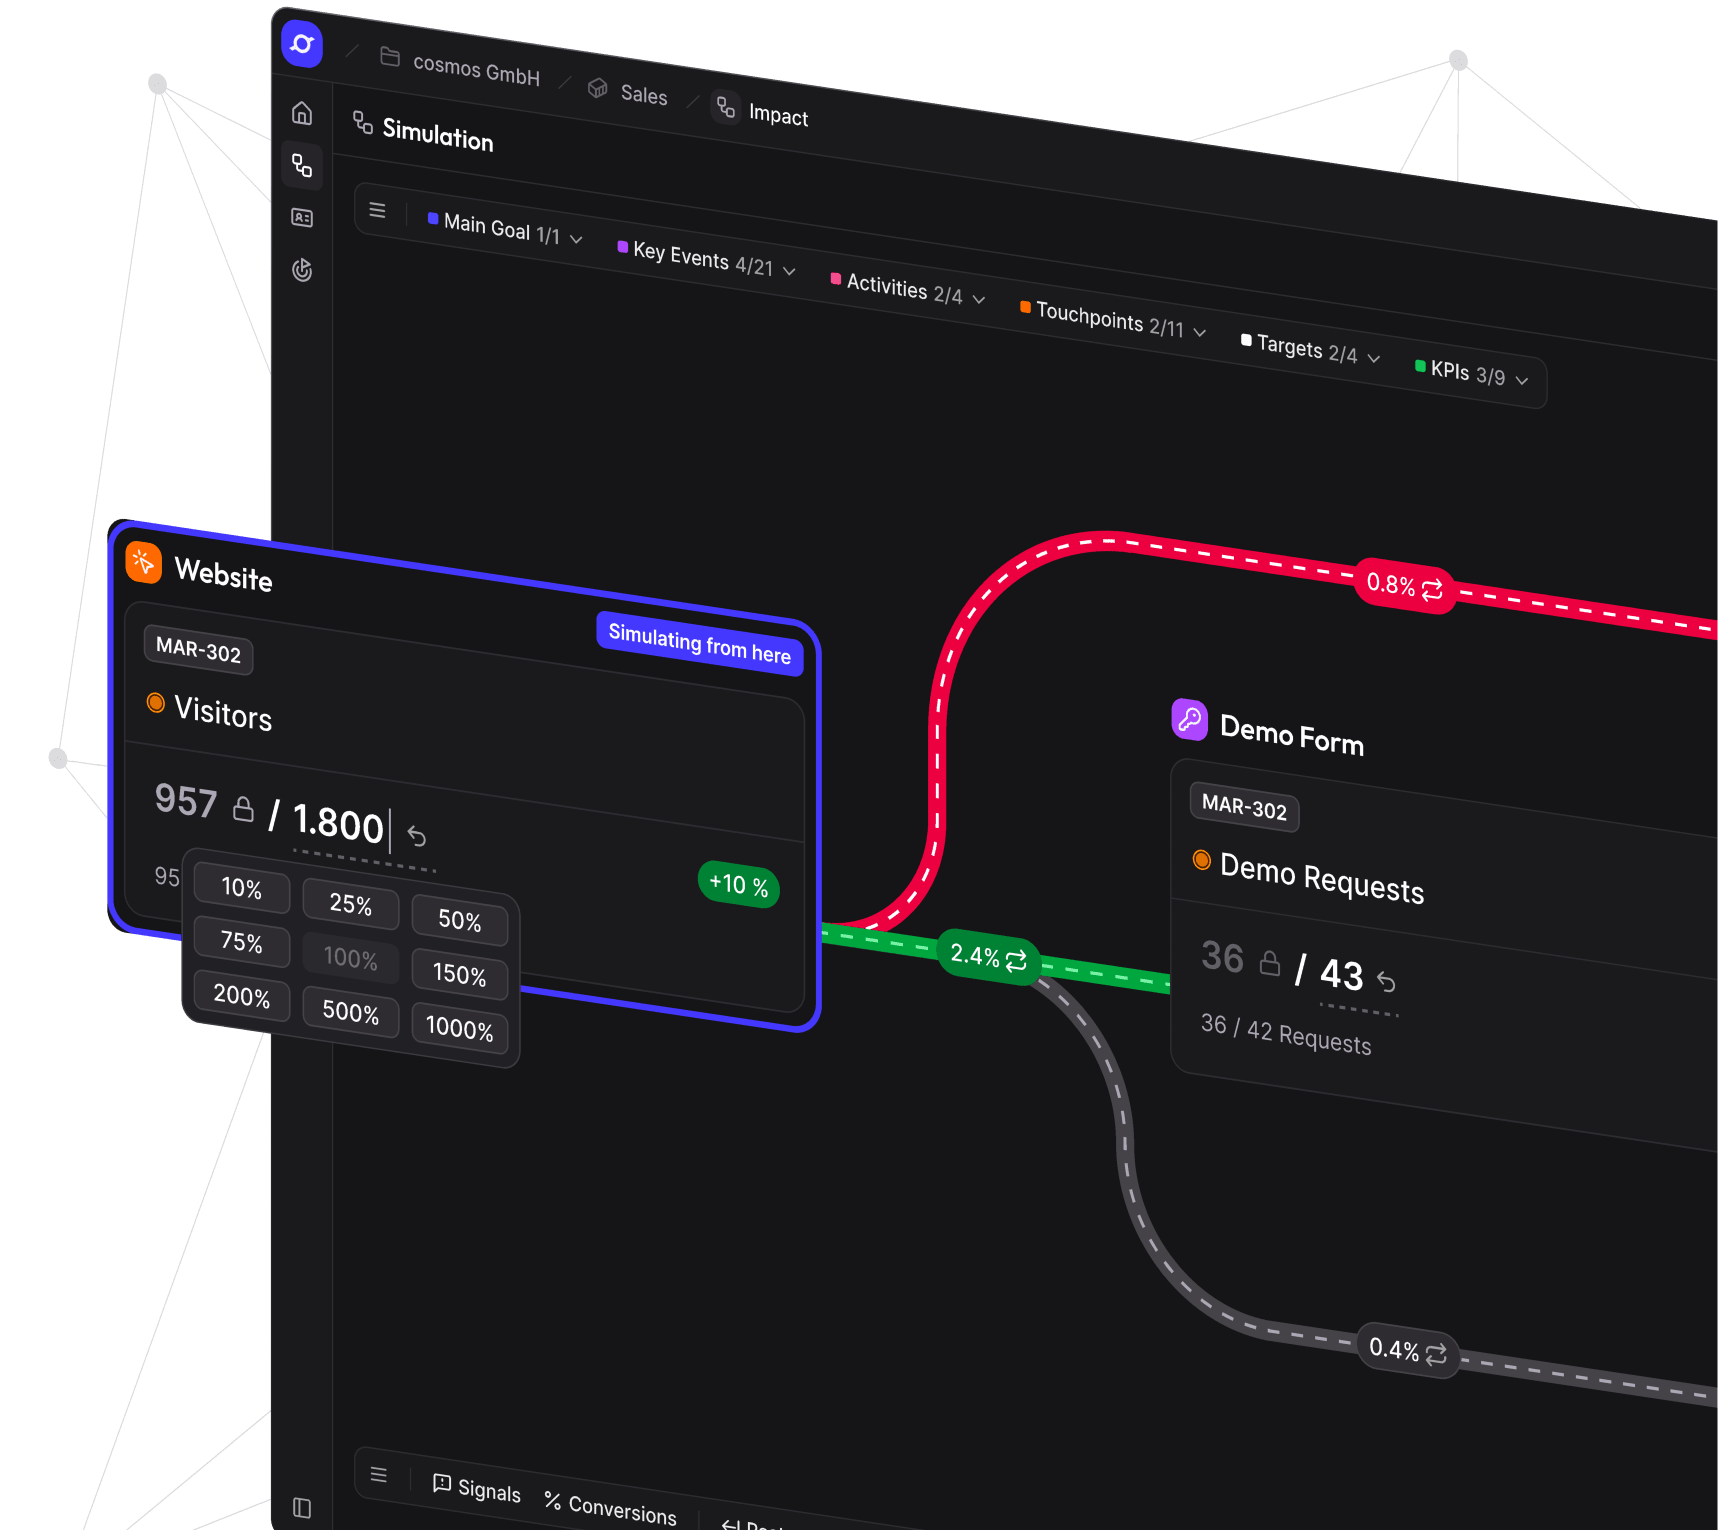
With cosmos™, marketing, sales and growth run their go-to-market together, not in silos. Initiatives, target groups and metrics connected in one Go-to-Market Brain that gets smarter with every campaign.
Budget efficiency
Spend only where it moves the needle
cosmos™ rates the potential of new initiatives before you commit any budget.
One picture
One data foundation for every team
Marketing, sales and growth see the same real-time picture instead of reconciling dashboards.
Go-to-Market Brain
Smarter with every initiative
Every result feeds back in and makes your next plan more precise.
Four levers for your go-to-market
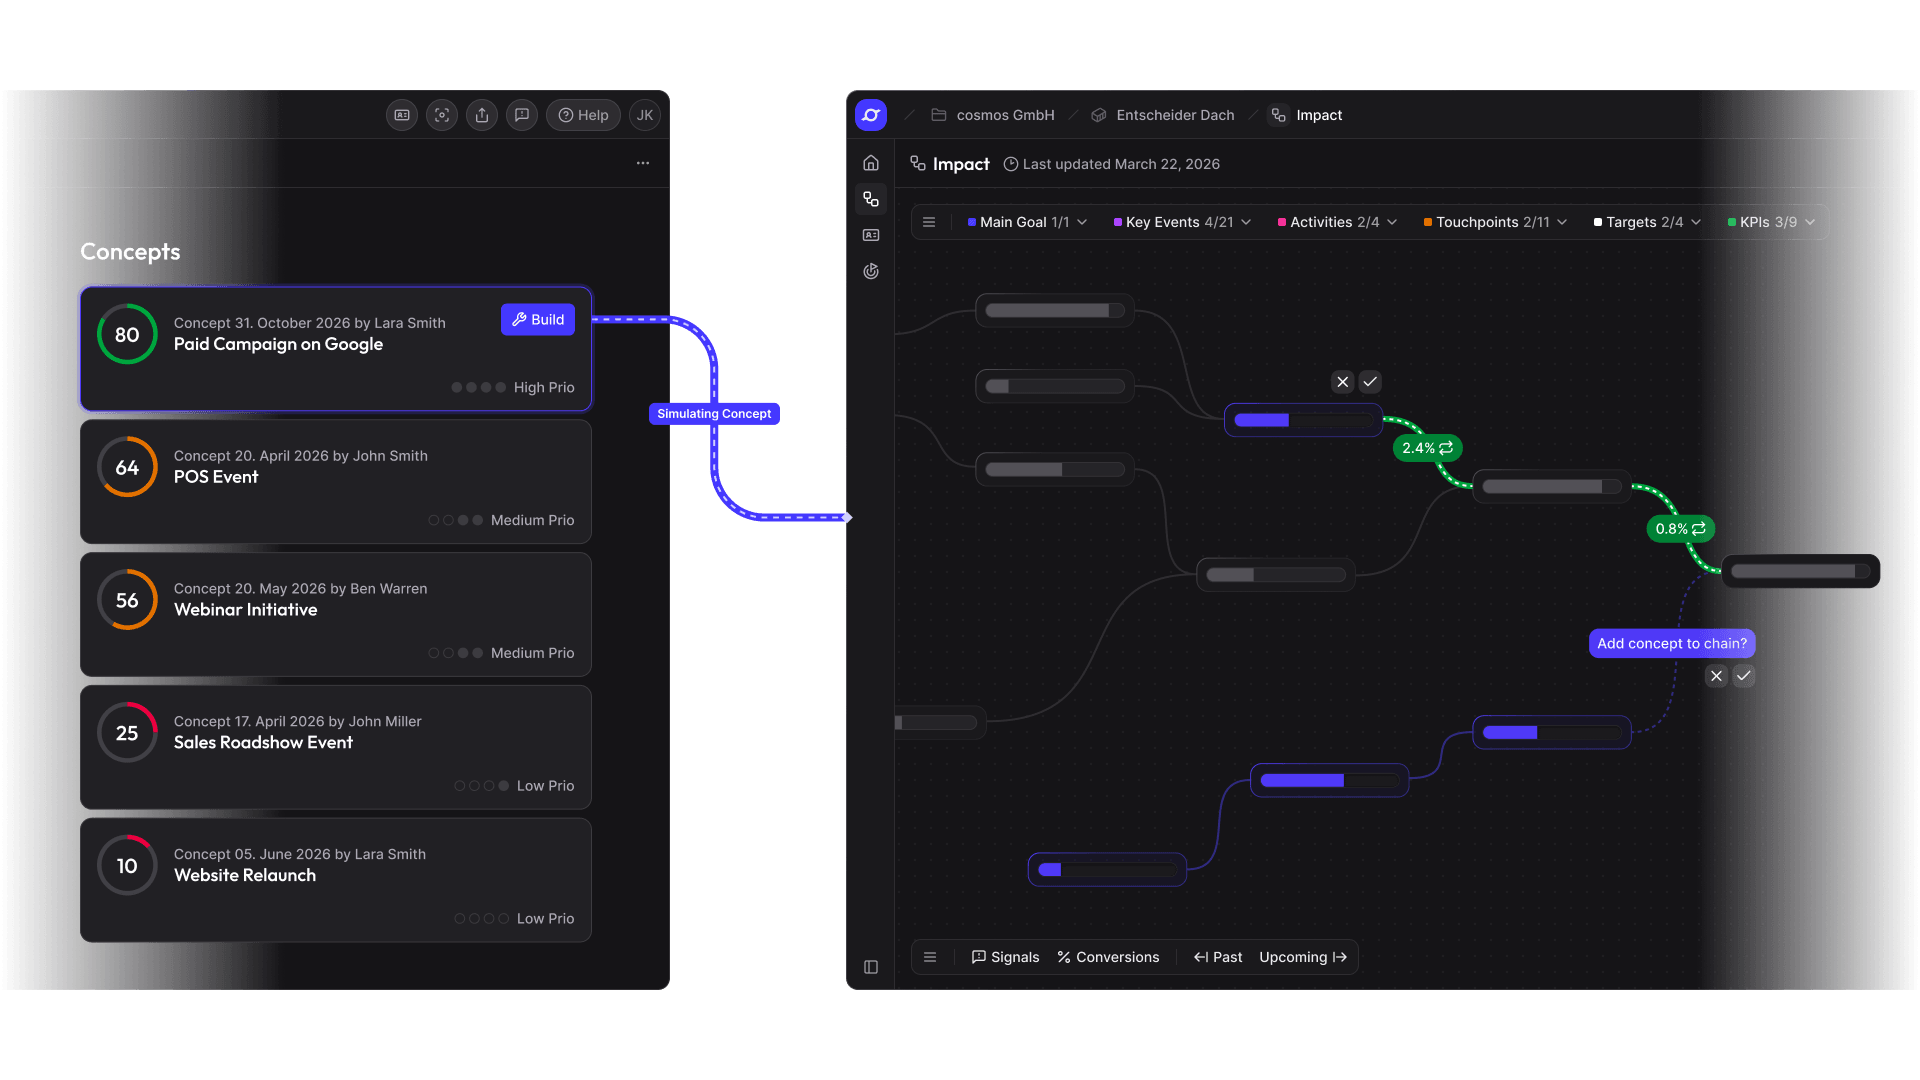
Evaluate first, then invest
cosmos™ forecasts the potential of new initiatives before you burn budget.
- Every concept gets a Potential Score with five sub-scores
- Simulate concepts in your impact chain before launch
- Every completed initiative sharpens the next forecast
A single source of truth for every team
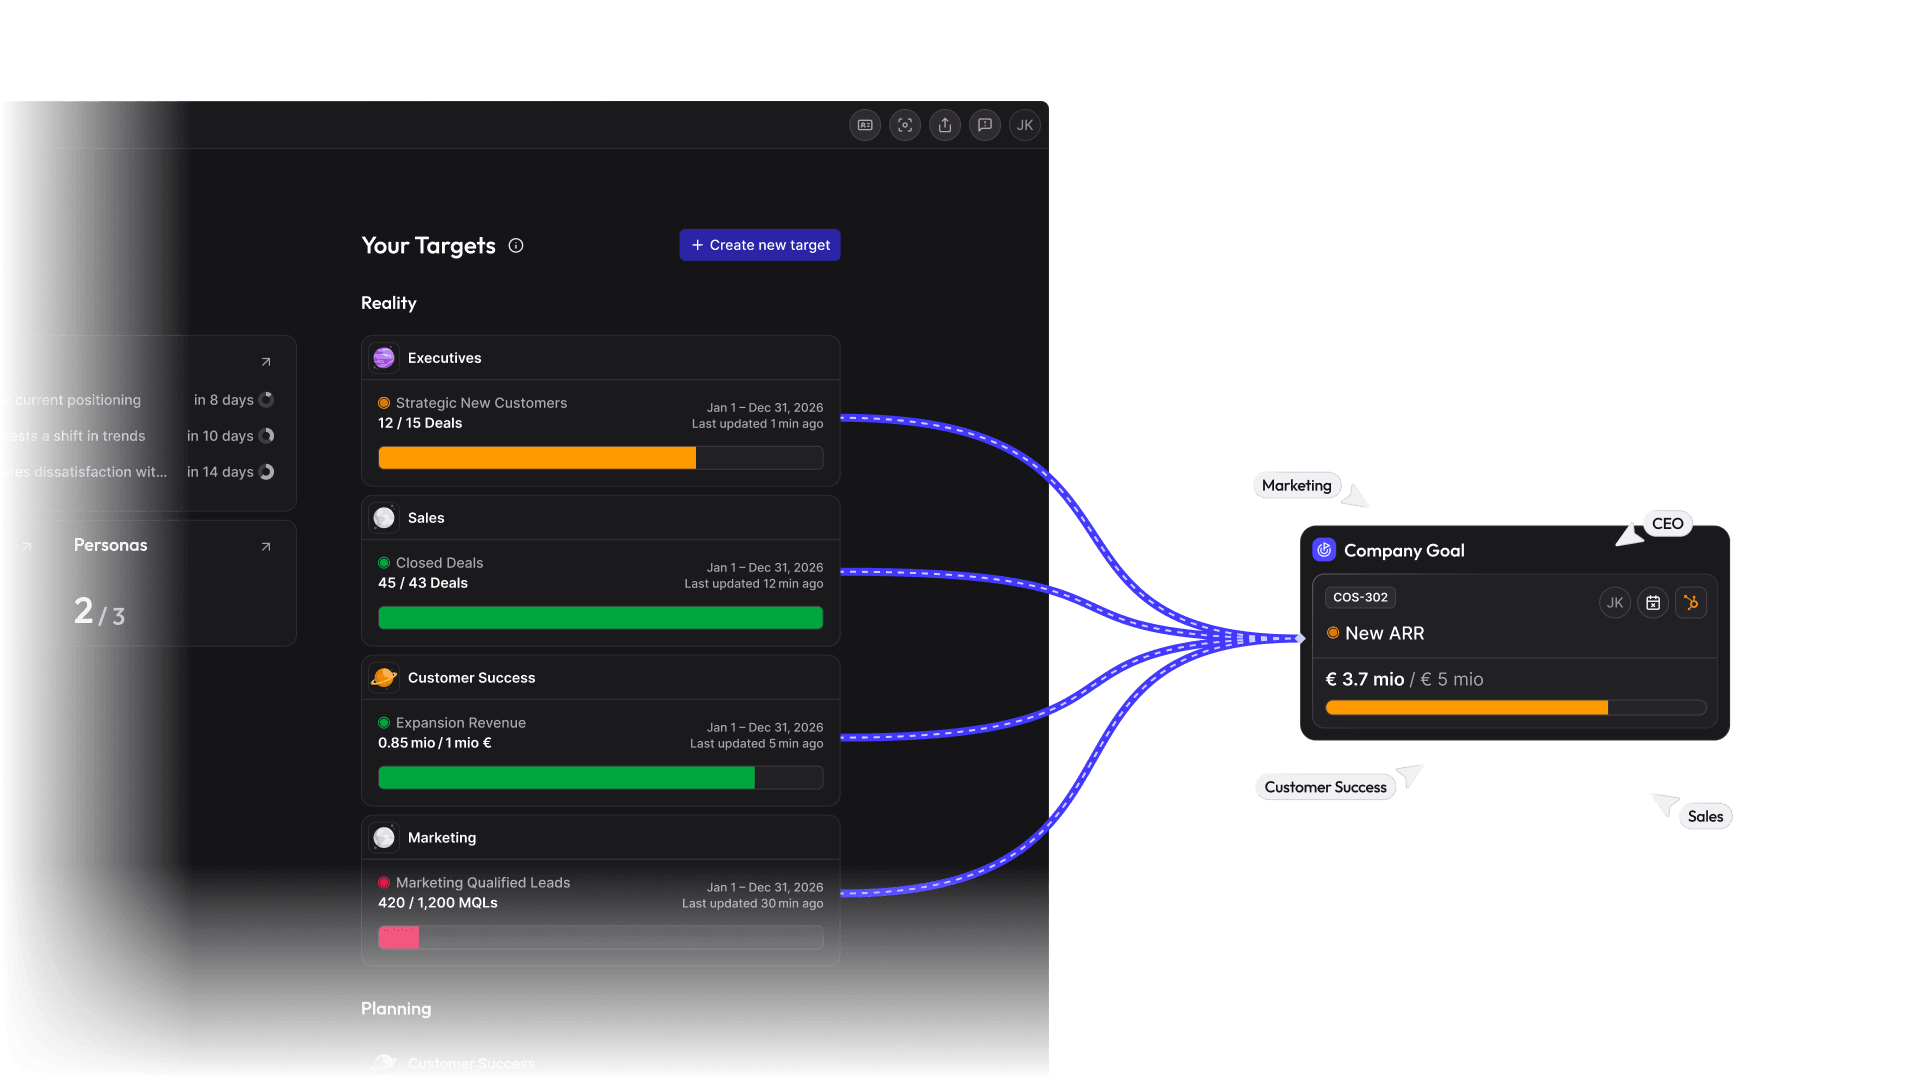
Run your go-to-market across teams in one place, instead of making decisions based on conflicting metrics.
- Data from 160+ tools flows into one shared picture
- Every initiative is linked to the goal it contributes to
- Marketing, sales and growth work from the same data foundation
Find root causes – don’t hunt for them
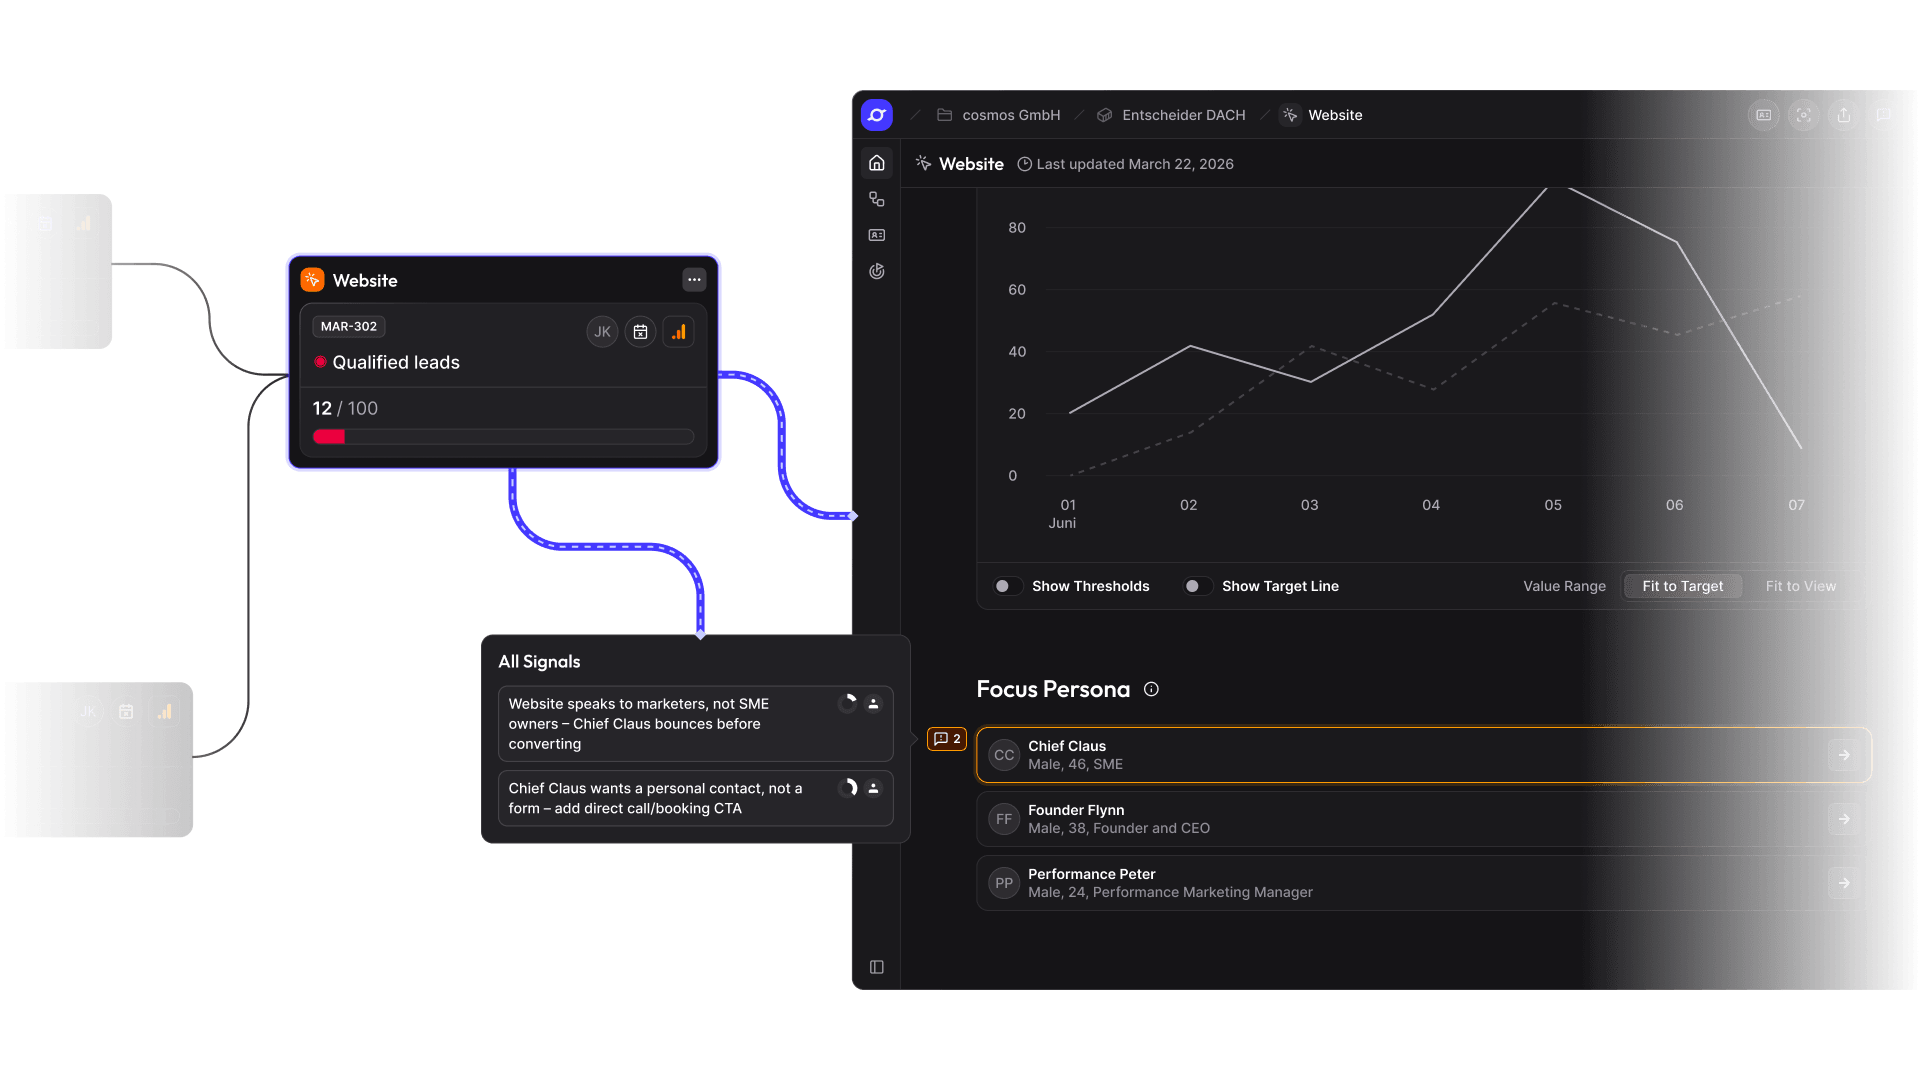
Find out why a metric is rising or falling without pulling data together first – all the context is already in one place.
- Every metric shows which goal it contributes to and which assumptions sit behind it
- The AI flags anomalies as signals, right where they arise
- Turn every insight into the next step on the spot
Strategy that keeps pace with the market
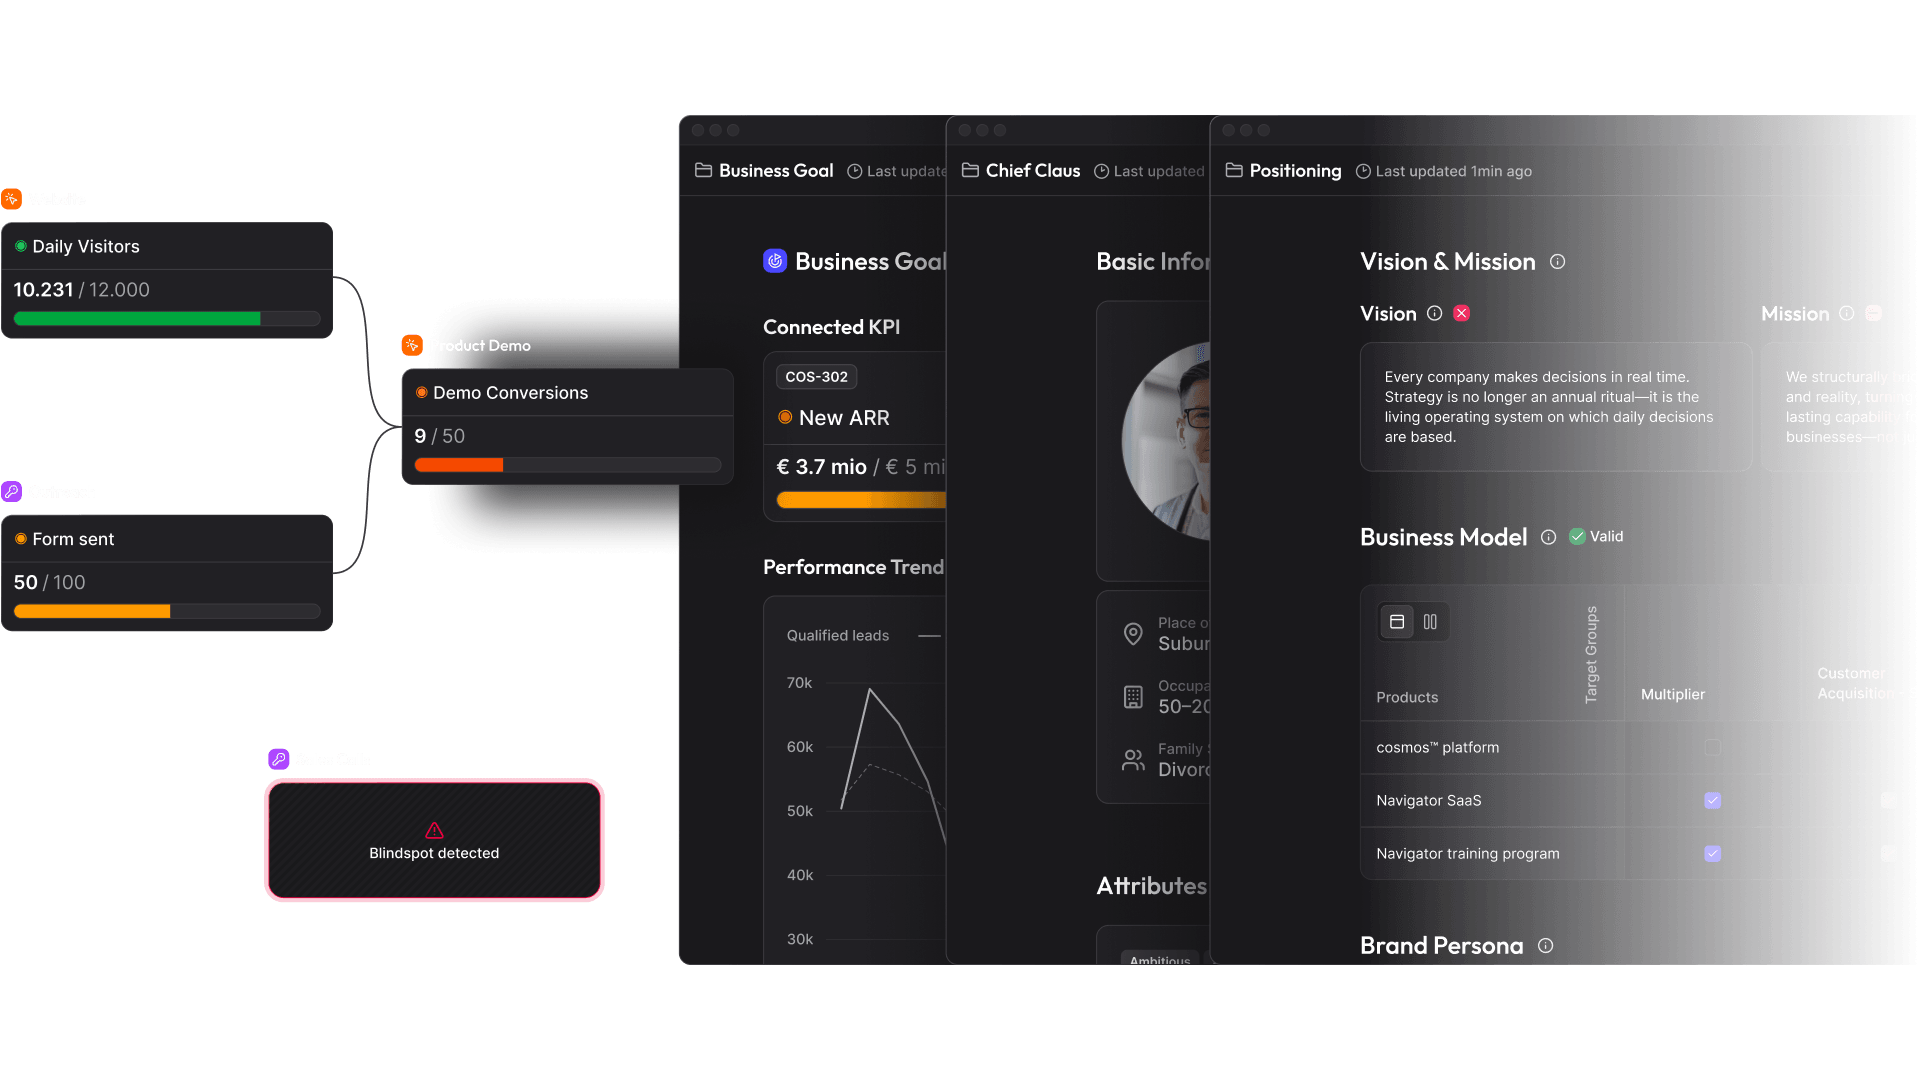
Positioning, personas and assumptions stay current, instead of gathering dust as a PDF in a shared drive.
- Your strategic foundation is connected directly to your numbers
- cosmos™ tells you when something no longer matches reality
- Changes apply instantly to every team and initiative
Customer voice
“We used to launch campaigns and only see weeks later whether they worked. Now we can see in advance where the budget will pay off.”
Wolf Albrecht, AI & Digital Marketing Leader, Dr. Beckmann Group
Same foundation, different questions
COO, Head of Strategy & Operations
Efficiency & information management
How can strategic work run with less effort, fewer tools and less friction?
CEO, Managing Director & Owner
Strategic leadership
Are we making the right decisions, and is the entire company on board?
Leadership, advisory board, strategy & innovation
Mid-market
Cut costs and reinvent the business at the same time?
- No implementation project
- No prep required
- Strategy management made simple
Frequently asked questions
No. cosmos™ connects to your existing tools through more than 160 integrations and adds what dashboards are missing: context. Every metric – whether synced automatically or maintained manually – shows which goal it contributes to and which assumptions sit behind it. You don’t just see that a number has changed; you see what it means for your go-to-market.
Every new concept gets a Potential Score with a rating and a short rationale. cosmos™ doesn’t look at the concept in isolation: it factors in everything it knows – your goals, personas and positioning, every ongoing and completed initiative, and all your learnings. That way, every idea is measured against your own reality, not generic best practices. Five weighted sub-scores – strategic fit, measurable impact, feasibility, overlap and differentiation – show where a concept is strong and where it falls short. You also get concrete recommendations for raising the score.
Yes. Each team keeps its own metrics, but everyone works from the same data foundation. Because every initiative is linked to the goal it contributes to, you can see how each team’s metrics connect – without reconciling dashboards.
Each initiative is measured over the timeframe in which its success actually shows. You might review a performance campaign at short intervals and a brand initiative over a longer horizon. That way, long-term initiatives don’t get written off too early.
That’s normal – and no obstacle. cosmos™ works on a simple principle: chaos in, structure out. Missing and outdated data is clearly flagged, and assumptions are labeled as such. The Clarity Score shows at any time how complete your data is and what your decisions are really based on.
Your initial picture is ready within the first week. Just bring everything you have – strategy decks, spreadsheets, data from your tools. cosmos™ organizes it and surfaces first insights. No implementation project, no complex migration.
No new slides needed. Your executive team has access to the real-time picture at any time, so meetings skip the status update and go straight to decisions. That makes cosmos™ the shared foundation for strategic goal-setting and budget discussions. For the board, partners or agencies, the Export Hub shares your latest status automatically – internally and externally.
To get started, one team in one area is enough. Five seats are included in the plan, and viewer seats are unlimited. More teams and areas can join step by step.